How to Read Your Water Quality Report
A water quality report is your supplier's yearly table of test results, due by July 1: find the columns for your area, compare each average with its MCL, and check the units first.
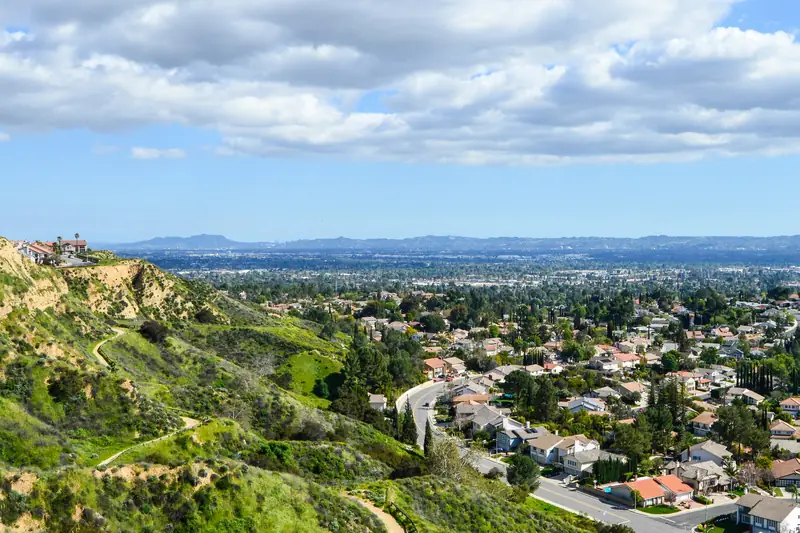
Call sheet: what this page covers
Before you scroll
- Every community water system must send its yearly report by July 1, per EPA; the 2026 editions cover calendar 2025.
- LADWP's Valley results sit in three columns: the LA Aqueduct Filtration Plant, the Northern Combined Wells and MWD Jensen.
- The MCL is the enforceable limit; the PHG is California's health goal and is often far lower, such as 10 versus 0.02 µg/L for chromium-6.
- ppm equals mg/L, ppb equals µg/L and ppt equals ng/L, so 1 ppm is 1,000 ppb.
- Hardness has no limit at all: LADWP lists it with unregulated substances (103 to 140 mg/L for Valley sources in 2025).
- Typos happen: San Fernando's 2025 table prints the chromium-6 health goal as 20 instead of 0.02.
A water quality report, also called a Consumer Confidence Report, looks like a wall of numbers. Most of it can be read with three questions: which column is mine, what is the limit, and what unit is this in. The rest is footnotes, and the footnotes are often where the useful detail hides.
Where do you find your water quality report?
Your supplier posts it online and must send it out each year by July 1. The State Water Board's CCR page says the 2025 report covers January 1 through December 31, 2025 and was due to customers by July 1, 2026. EPA also runs a search tool for finding any system's report.
In the Valley, the four current reports are LADWP's Drinking Water Quality Report 2025 (published July 2026), Burbank Water and Power's report on its water quality reports page (printed in its June 2026 newsletter), Glendale Water & Power's report on its reports page (published July 1, 2026), and the City of San Fernando's annual report. Your water bill names your supplier if you are unsure, and the tap water folder maps who serves which neighborhood.
What do MCL, PHG and DLR mean?
The MCL is the legal ceiling, the PHG is the health goal, and the DLR is the lowest level a lab must report. LADWP's report defines each on page 20. An MCL (maximum contaminant level) is "the highest level of a contaminant that is allowed in drinking water", set as close to the PHG as is technically and economically feasible.
A PHG (public health goal) is the level below which there is no known or expected risk, set by California's environmental protection agency. EPA's version is the MCLG. Chromium-6 shows how far apart the two can be: the State Water Board's FAQ gives an MCL of 10 µg/L, a PHG of 0.02 µg/L and a DLR of 0.1 µg/L. A result above the PHG but below the MCL is legal; the chromium-6 page puts the Valley's 2025 figures against both.
A few other letters turn up. AL is the action level, used for lead and copper at household taps. MRDL is the disinfectant limit, 4 mg/L for chloramine. NL, a notification level, is an advisory figure for chemicals that have no MCL yet. TT means a treatment technique is required instead of a number.
Which table applies to your neighborhood?
It depends on your supplier, and on LADWP water it also depends on where in the city you live. LADWP's page 21 sends San Fernando Valley readers to three plant columns: MWD Jensen, the Northern Combined Wells, and the Los Angeles Aqueduct Filtration Plant in Sylmar. Western LA reads only the aqueduct plant, and the Harbor area reads the three MWD plants. A few results, such as the disinfectant and lead, are reported city-wide.
Burbank prints one column, "Burbank Water", covering imported supply mixed with groundwater that Burbank treats itself. Glendale prints three: MWD Weymouth water, MWD Jensen water and its own Glendale Water Treatment Plant, and some plant figures were measured before blending. San Fernando prints one column for its well system.
LADWP sorts its results into four tables: health-based primary standards, aesthetic secondary standards, unregulated substances, and a federal survey of emerging contaminants sampled in 2023 and 2024. The water sources page explains why the Valley gets three columns.
| Supplier | Published | Columns for Valley homes | Unit notes |
|---|---|---|---|
| LADWP | July 2026 | LA Aqueduct Filtration Plant, Northern Combined Wells, MWD Jensen | "<" means below the reporting limit |
| Burbank Water and Power | June 2026 | Burbank Water (one blended column) | ND = not detected; hardness also in gpg |
| Glendale Water & Power | July 1, 2026 | MWD Weymouth, MWD Jensen, Glendale Water Treatment Plant | Some plant figures are before blending |
| City of San Fernando | 2026 | One column for the city's wells | Check printed goals against state figures |
What do ppm, ppb and ppt mean?
They are parts per million, billion and trillion, and each matches a metric unit: ppm is mg/L, ppb is µg/L and ppt is ng/L, as Burbank's 2025 report spells out in its abbreviations. One ppm equals 1,000 ppb, and one ppb equals 1,000 ppt.
The unit changes by substance, so read it before the number. Hardness and nitrate come in mg/L, chromium-6 and lead in ppb, and PFAS in ppt: EPA's limit for PFOA is 4.0 ppt. To turn hardness into grains per gallon, divide mg/L by 17.1, as Glendale's footnote says; Burbank's 286 mg/L becomes about 16.7 gpg. The hardness page has every supplier's figure.
Watch for averages that look larger than their range. LADWP marks some results "HRAA", the highest running annual average, which can include samples from the year before and so sit above that year's range. Most limits are judged on yearly averages, not single samples.
Report numbers worth knowing
- July 1Annual deadline for sending the report to customersU.S. EPA
- 3Columns that cover LADWP's Valley neighborhoodsLADWP Drinking Water Quality Report 2025
- 17.1 mg/LHardness equal to one grain per gallonGlendale Water & Power 2025 Water Quality Report
- 5 µg/LArsenic level, half the MCL, at which a report must print advisory textLADWP Drinking Water Quality Report 2025
- 1,000 mg/LTDS secondary level in LADWP's table; Valley sources ran 234 to 297LADWP Drinking Water Quality Report 2025
What do secondary standards cover?
Secondary standards (SMCLs) cover taste, odor and appearance, not health. LADWP's secondary table lists chloride (500 mg/L), iron (300 µg/L), manganese (50 µg/L) and total dissolved solids (1,000 mg/L), among others. Its Valley sources ran 234 to 297 mg/L in TDS in 2025, well under that level.
The figures printed can differ between reports: San Fernando's table shows 500 mg/L for TDS, the lower of California's two secondary levels. Odor is scored in threshold odor numbers; Burbank reported 0.0 against a limit of 3.
Hardness is not in either standards table, because it has no limit. LADWP lists it among unregulated substances, at 103 mg/L for aqueduct plant water, 115 for the Northern Combined Wells and 140 for Jensen water in 2025. That is a comfort and scale question, which the softener page takes up.
What should you look for first in a water quality report?
Look at the compliance column, then lead, then any notices. LADWP's tables carry a "Meets Primary Standard" column of YES or NO, and San Fernando's has a violation column. A NO in the first, or a Yes in the second, is the line to read in full.
Next, find the lead and copper table: it gives a 90th-percentile result from home taps, the number of homes sampled and how many were over the action level. LADWP's 2023 round shows 3.9 ppb, with 3 of 105 homes over 15 ppb. The lead page explains why that figure reflects home plumbing.
Then read the text pages. LADWP's 2025 report prints an arsenic advisory because its highest result, 7.0 µg/L, passed 5 µg/L, half the limit, and it describes chlorate found in two storage tanks. If you are buying treatment, note your disinfectant and hardness too; the chloramine page covers the first.
Finally, sanity-check odd figures against the state's. San Fernando's 2025 table prints the chromium-6 PHG as 20, where the state's goal is 0.02 µg/L, and lists a chlorine average of 2.07 ppm that falls outside its own printed range of 1.45 to 1.89. The State Water Board's Drinking Water Watch database holds the underlying sample data.
Where this page comes from
This page uses the 2026 water quality reports (2025 data) from LADWP, Burbank, Glendale and San Fernando, EPA's consumer page on Consumer Confidence Reports, the State Water Board's CCR page and its chromium-6 FAQ, and EPA's PFAS rule page, all read in October 2026. Definitions are quoted from LADWP's abbreviations page; no utility is graded or ranked, and the phone numbers printed in the reports are left out.
Still asking
Why is my report always a year behind?
Each report covers the previous calendar year, so the 2026 edition shows 2025 results. Lead sampling runs every three years, which is why the 2026 reports still show 2023 tap results.
What does a less-than sign mean in LADWP's tables?
LADWP's key says "<" means below the detection limit for reporting purposes. A result of "<0.1" for chromium-6 means none was found at or above 0.1 µg/L, not that the water holds exactly that amount.
Is a result above the PHG a violation?
No. Only the MCL, MRDL, action level or a required treatment technique is enforceable. The PHG is a health goal, and many results sit between the two.
Why does LADWP's hardness differ from what a home test kit shows?
Kits often read in grains per gallon, while LADWP's table uses mg/L, so divide the table figure by 17.1 before comparing. LADWP's own Valley columns also spread from 78 to 151 mg/L across 2025 samples.
Can renters get the water quality report?
Yes. The reports are posted on each supplier's website for anyone to read, and EPA's report search tool can find them too.
Does the report cover my home's pipes?
Mostly no. Most results come from treatment plants, wells and the distribution system; only the lead and copper samples come from household taps, and those homes were chosen for their plumbing age.
What is UCMR5 in LADWP's report?
It is EPA's fifth round of monitoring for unregulated contaminants. LADWP sampled 29 PFAS and lithium from December 2023 to September 2024 and found only lithium.
That is the end of this page. Back to the full list of Valley water and plumbing pages.